View Modes
List View
The default view shows spans in a flat list. Each span displays:- Name - The span operation name
- Status - Success, error, or unset
- Duration - How long the span took
- Start time - When the span started
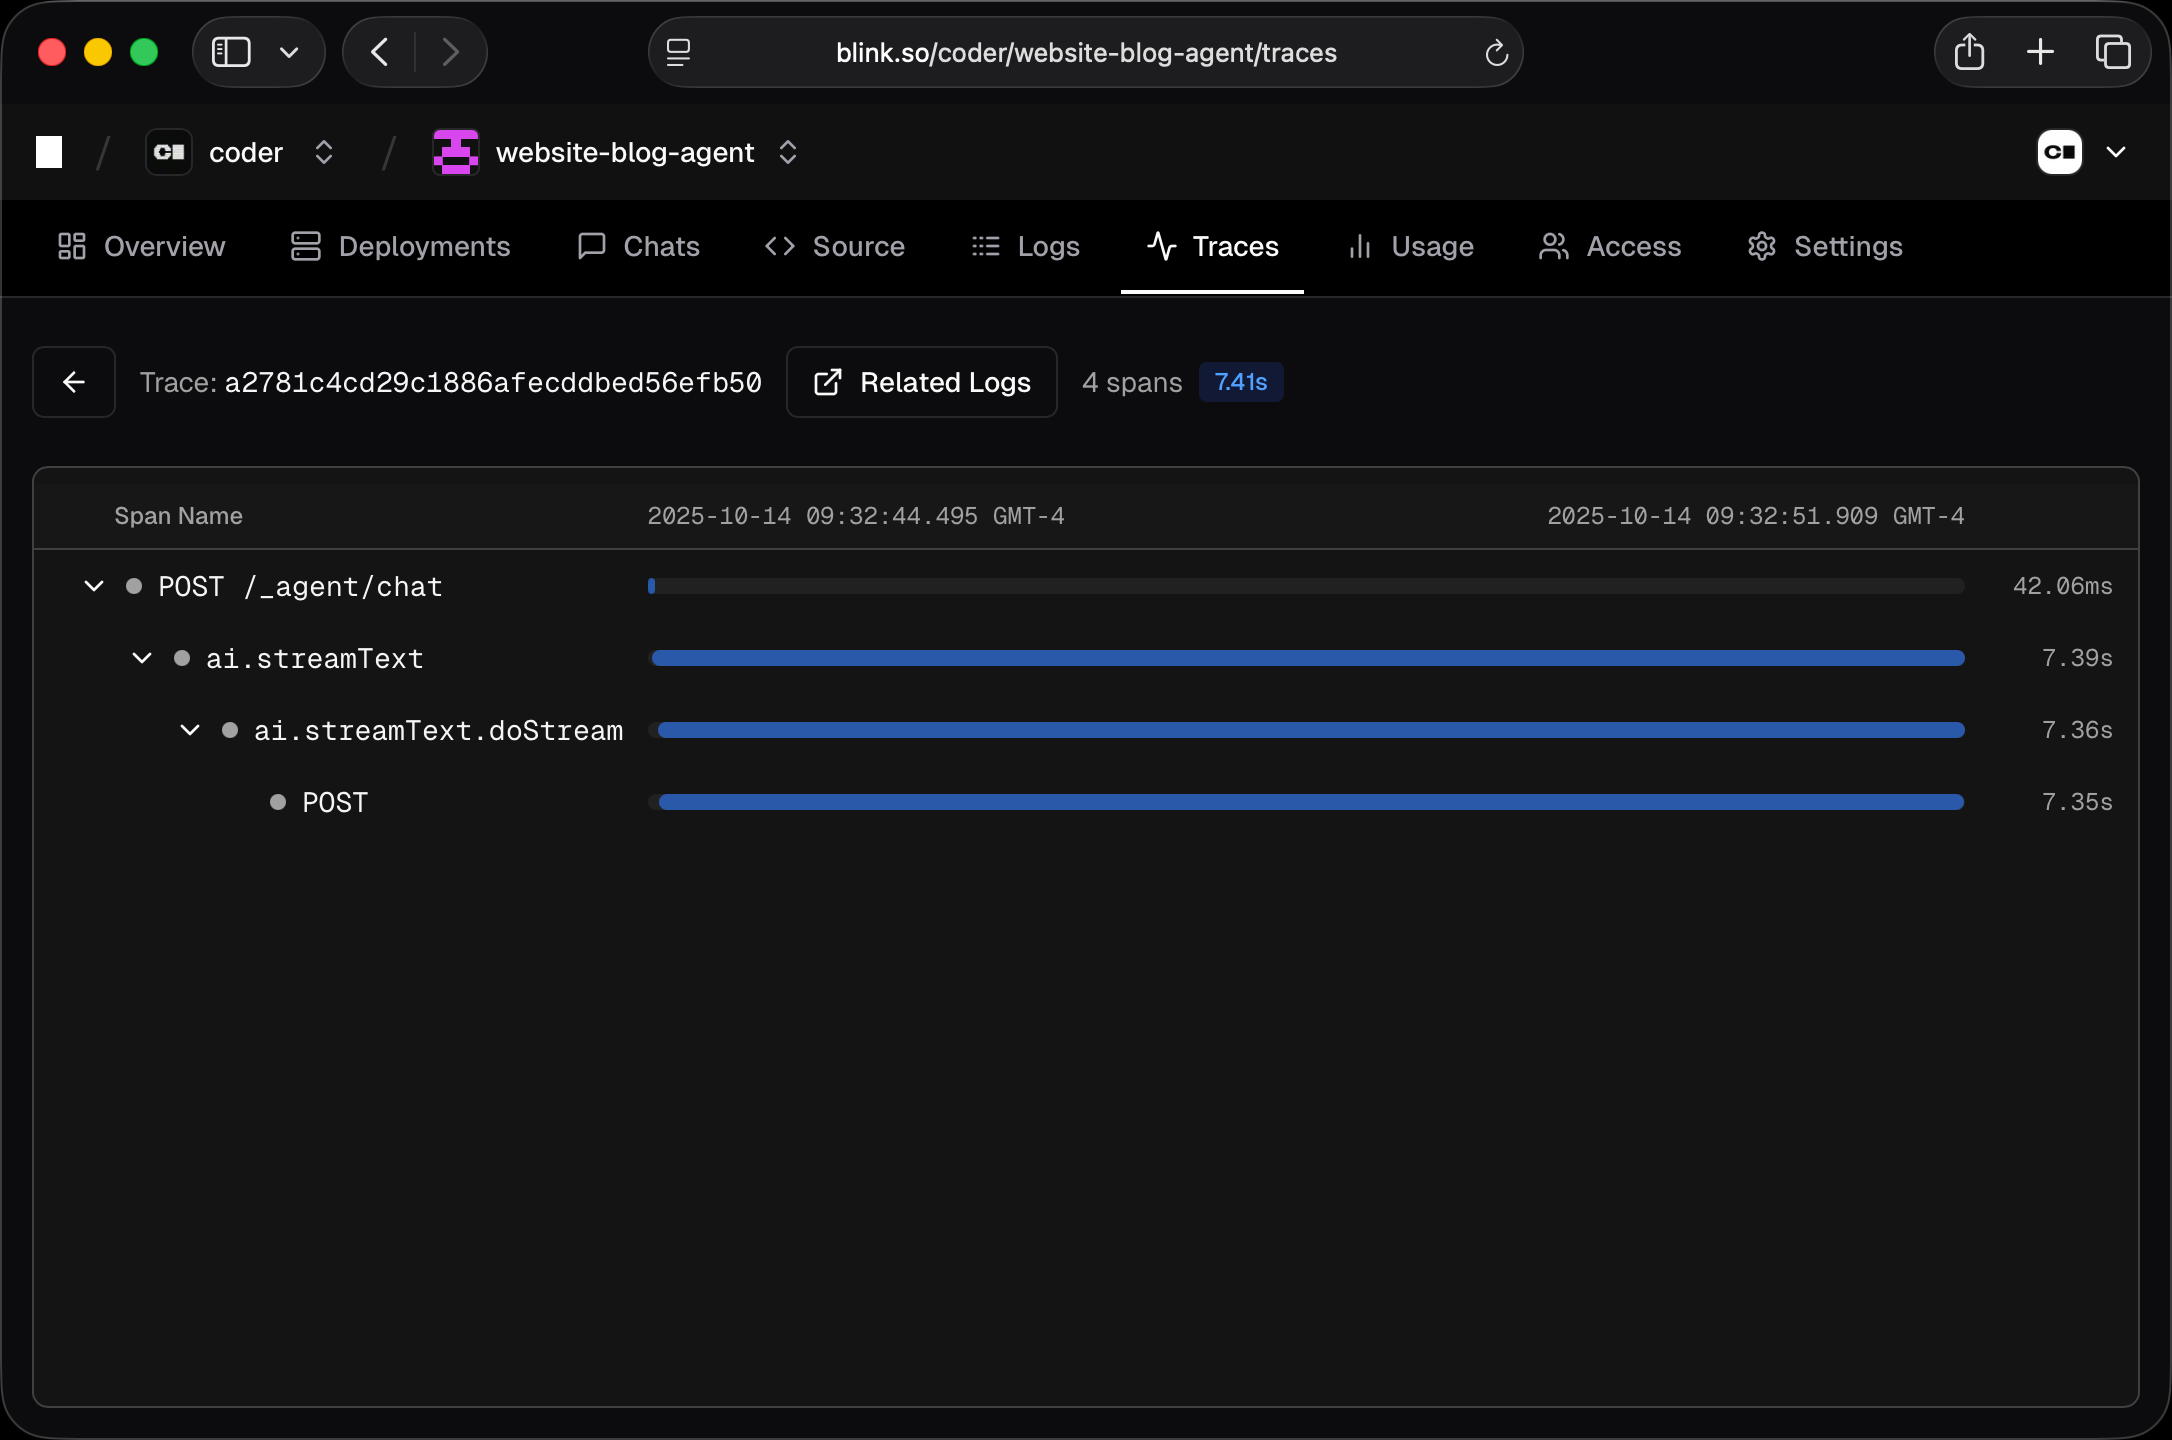
Tree View
Click on a trace ID to see all spans in that trace as a hierarchical tree. This shows the parent-child relationships between spans and visualizes timing with a waterfall chart.Filtering
- Date range - Select a time range (default: last 24 hours)
- Filters - Add filters to match spans by any field. Click the filter button, enter a field name and value, and spans matching all filters will be shown.
span.status_code and value ERROR.
Span Details
Click any span to view:- Attributes - Key-value metadata attached to the span
- Events - Timestamped events within the span
- Logs - Associated log entries (if
trace_idmatches)